Coach User Manual
Who is a “coach”?
- A person who :
- adds, manages, and tracks the progress of groups of students.
- has access to student progress data in the form of coach reports
- provides instructions to students
Coach Reports
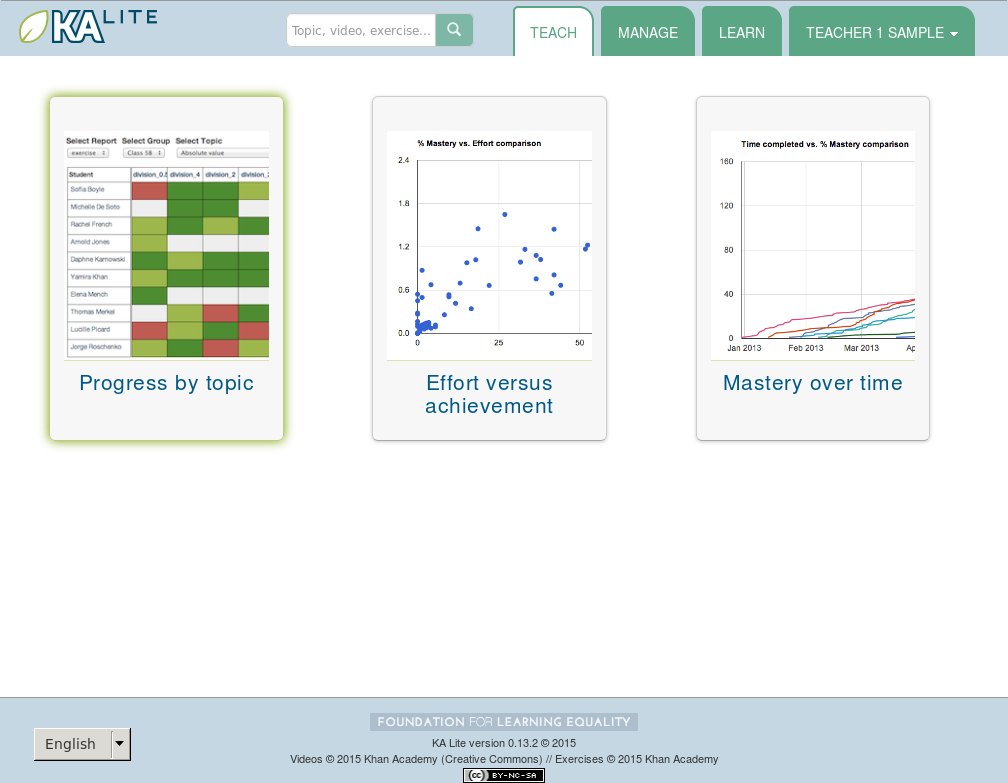
Coach reports are visualizations of the data generated by your learners. The goal of the coach reports is to put the data into an easy to understand format, so you can understand how learners are progressing and where they need the most help.
The Report Page displays three types of reports. Coach may change groups and facilities anytime in order to track different sections.
Tabular Report
A tabular report is a grid that can show how students are doing in specific subjects at a high level. As a coach, you can select which group of students you’d like to check progress for, and which subset of videos or exercises you’d like to see reports on. This allows you to easily identify which areas learners are struggling in, as well as which learners are doing well.
Progress By Topic
- Select the “Teach” tab at the top of the page.
- Select the appropriate facility from the drop down menu to view reports for a specific facility.
- Select content you would like to see reports for from the drop down menu (videos or exercises).
- Select a topic you would like to see the reports for from the drop down menu.
- A table should be generated with the data requested.
The color of the rectangles in the table indicate how that student is doing on a particular exercise. The following key explains the color code of the table cells (this information will also be available on the Coach Report page):

|
Not Attempted: The student has not attempted the subtopic. |

|
In Progress: The student has completed a few questions, |
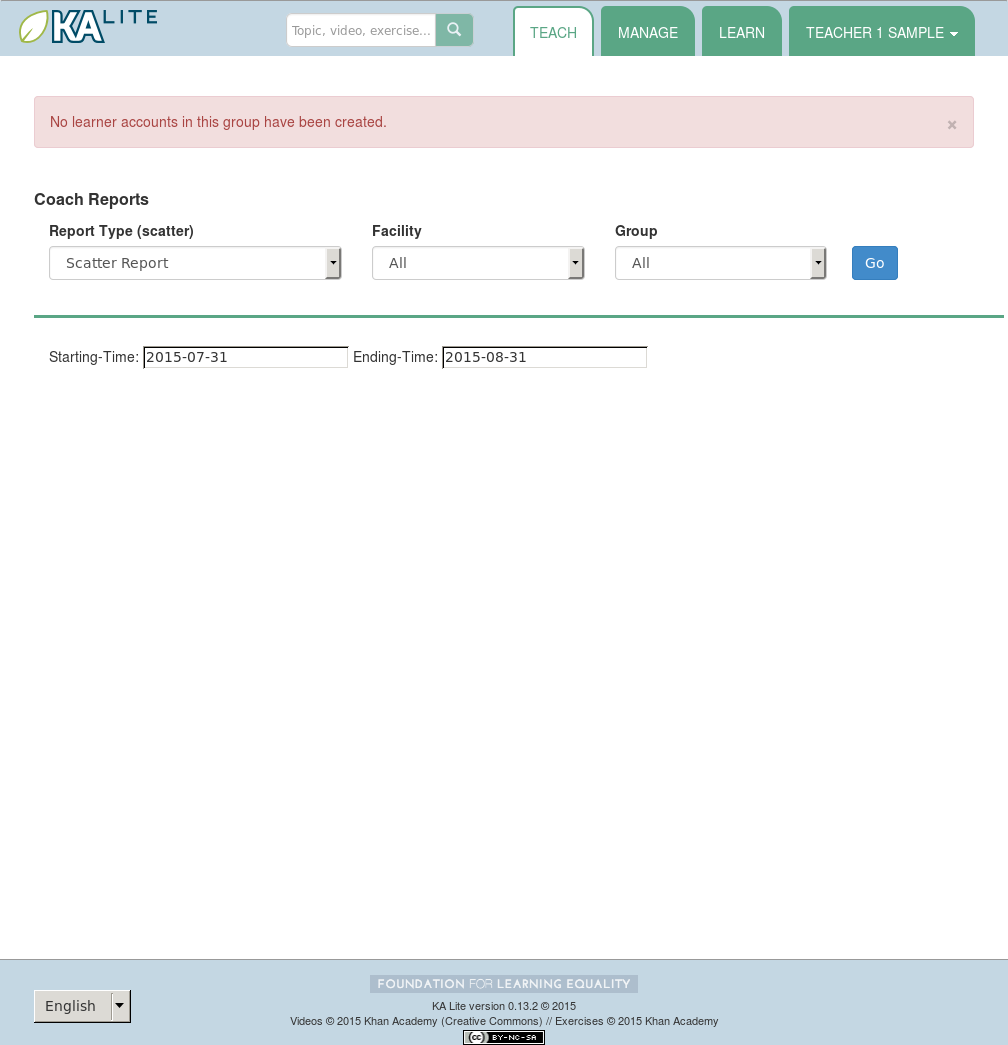
Scatter Report
The scatter plot report allows coaches to plot various metrics, like learner effort against other metrics, like learner mastery. This helps coaches view data, and identify high-level trends in learner progress.
Effort Versus Achievement
- Make sure you are on the Coach Reports page by selecting the “Teach” tab at the top of the page.
- Select “Scatter Report” from the drop down menu.

- Select the facility and/or group that you’d like to view the report for from the drop down menus.
- Select the range of time that you’d like to view data for.
- A graph will be generated, where each black dot represents a student’s effort vs achievement. (This may take a few moments to load.)
- Each individual dot can be cliked to show the student’s details.
Scatter Report
The timeline report allows coaches to track individual learners’ mastery of subjects over time. This is a helpful way to view learner progress, and helps with identifying struggling learners relative to their peers.
Mastery Over Time
- Make sure you are on the Coach Reports page by selecting the “Teach” tab at the top of the page.
- Select “Timeline Report” from the drop down menu.
- Click the “Go” button to view a timeline of students’ mastery over time. (The report may take some time to load.)
